Today, I’d like to introduce a more advanced tool for visual regression testing: Visual Regression Tracker.
If you’ve worked with visual regression testing before, you know that sometimes it’s necessary to involve multiple people in the approval and analysis process to determine which changes are expected and what are not. While tools like SauceLabs, BrowserStack, and LambdaTest and others can help, they can become costly, especially when visual regression testing isn’t the top priority. In some cases, investing in these tools is worthwhile, but it’s not always feasible.
Now, imagine having an open-source solution that integrates with various test automation tools and provides a more efficient way to handle visual regression testing. That’s where Visual Regression Tracker comes in.
I’ve already written an article about visual regression testing in my last post. If you’d like to understand what Playwright offers out of the box, I recommend checking it out.
Visual Regression Tracker integrates seamlessly with Playwright, allowing for efficient screenshot comparisons to detect visual changes and potential bugs. Additionally, since it can be set up on our own infrastructure, we have full control over the testing environment, making it a powerful and cost-effective solution for large-scale visual regression testing.

https://github.com/Visual-Regression-Tracker/Visual-Regression-Tracker
Visual Regression Tracker is an open-source tool consisting of two main elements. The first is an application for storing visual test automation results, offering features such as user authentication and marking ignored areas for tested applications. This works similarly to a mask in Playwright—where a mask is also available—but ignored areas can be marked directly from the web app. We can also decide what is approved for each branch, allowing the entire team to access it through the web application using their own user accounts.
The second element is a library that we install in our test automation framework.
Visual Regression Tracker can be integrated not only with Playwright but also with other popular testing frameworks such as Robot Framework, Cypress, and CodeceptJS.
Additionally, the installation includes a REST API, allowing us to create custom integrations with Visual Regression Tracker, even if we use a tool that isn’t currently supported .e.g., for mobile test automation frameworks.
How does it work?

First, we need to establish a connection from our code. To do this, we can use a specific agent or the REST API to send test results. To set up all essential parameters, we need to provide our settings either from a file such as vrt.json or directly from the code.
Once the results are sent, a comparison is performed, and the results are saved to a database (PostgreSQL with database migration). Alternatively, we can store them in a backend volume, such as Amazon S3.
Another container is used for the frontend, where we can analyze and approve images.
How to install it?
The easiest way to install Visual Regression Tracker is by using an installation script, which sets up Docker containers, starts them, and makes the application available on our machine.
To do this, I use the following command:
curl https://raw.githubusercontent.com/Visual-Regression-Tracker/Visual-Regression-Tracker/master/vrt-install.sh -o vrt-install.sh
chmod a+x vrt-install.sh
./vrt-install.shDuring the installation process, all essential files are downloaded. Before running this script, it is important to ensure that Docker is running on our computer.
After installation

After installation, we see a login form for the tool, which is available on port 8080 in a web browser. To log in, you need to use the credentials created during the installation process.
In addition to installing Visual Regression Tracker via Docker, we need to install the agent-playwright library (which is related to the tool) in our testing solution. This library allows us to integrate our tests with Visual Regression Tracker.
We can install the library as an NPM package using a simple command.
npm install @visual-regression-tracker/agent-playwright
After adding the library, we need to set up its configuration. We have two options for providing settings: we can either create a vrt.json file or use an explicit configuration in the code.
I prefer the first option because it allows us to configure the setup without modifying the code.
vrt.json file
One way to configure a local instance of Visual Regression Tracker is by using a vrt.json file. In this file, we need to set the apiKey, which can be found during the installation process in the setup logs.
Additionally, we can enable soft assertions by setting the "enableSoftAssert" parameter to true. This ensures that tests won’t fail when the tool detects visual regressions—instead, all failures will be logged in Visual Regression Tracker for review.
The approach to soft assertions can vary depending on the team and project requirements. Some teams prefer tests to always pass while collecting results with potential issues, which are then reviewed manually. On the other hand, some teams prefer a stricter approach where each failure is highlighted clearly, causing the test to fail. Both methods have their pros and cons, and the choice depends on the specific context of the project and application.

The API token can be copied from the logs generated during the installation process. Afterwards, the token needs to be added to the apiToken parameter in the vrt.json file.
VRT.json file


Apart from the API token, we can also find additional information about the login credentials (username and password) for the local instance of the tool.
If the default method of generating this data doesn’t meet our needs, we can easily update it by editing the seed.ts file and modifying the two highlighted variables shown in the screenshot. This file is located at:
https://github.com/Visual-Regression-Tracker/backend/blob/master/prisma/seed.ts

If you edit this area, the approach for generating a default password will change.
Logging into Visual Regression Tracker

After logging into the app, we see the settings of the default project. Here, we can change the project name, set a default branch, and configure basic settings related to the threshold. The threshold determines how much a page can differ from the baseline.
If the threshold is set too low, it may generate too many false positives, leading to excessive time spent analyzing results. Based on my experience, it’s best to test this within our own application. Initially, conducting a small Proof of Concept (PoC) within the team can help. After some observations, it will be easier to determine the appropriate threshold values for our needs.

Set up a connection from a test automation framework to Visual Regression Tracker
To connect with our test automation solution, we need to add the VRT library to our repository and the vrt.json file. We have available four agents for this tool.
In our case, we need to install the Playwright agent
npm install @visual-regression-tracker/agent-playwrightSimple VRT.json file looks like this:
{
“apiUrl”: “http://localhost:4200”,
“project”: “Default project”,
“apiKey”: “tXZVHX0EA4YQM1MGDD”,
“ciBuildId”: “commit_sha”,
“branchName”: “develop”,
“enableSoftAssert”: false
}
- apiUrl – in this place we need to pass url to our visual regression tool instance
- project – it’s the name of the project
- apiKey – it’s the apiKey from the docker containers installation process
- ciBuildId – is a useful parameter for associating specific changes with a commit SHA, a Jenkins job number, or any other CI/CD job identifier. This helps track changes more effectively in Visual Regression Tracker.
Another way to set up Visual Regression Tracker is by adding the configuration directly in JavaScript (JS) or TypeScript (TS).
What else do we need to set up in the code?
Apart from adding the VRT.json file and the required library to our test solution, I’m going to create a separate file for the Visual Regression Tracker (VRT) setup.
First, we need to use the vrt.start() method for initialization and vrt.stop() for teardown. We can place vrt.start() inside the beforeAll clause and vrt.stop() inside the afterAll clause to ensure proper test execution.
What can we configure in VRT?
It’s possible to take a screenshot of an entire page using the trackPage method or capture a screenshot of individual elements using the trackElementHandler method.
trackPage method
This method not only allows us to assign a name to the screenshot but also supports additional parameters that influence how visual regression tests are performed. These parameters enable us to customize the execution of visual regression tests based on our specific needs and the requirements of the web application.

we can define whether to take a screenshot of the entire page, apply masks, and specify the quality of the screenshots.
The available configurations provide more options compared to the default visual regression mechanism in Playwright. This gives us greater control over our results and the testing process.
Comparing Web Elements
The tool provides options for comparing specific elements within a web application. This is particularly useful when certain parts of the page are dynamic and may change, but we still want to verify the correct display of selected elements across different systems and browsers.
We’re starting work with Visual Regression Tracker – let’s write our first test.
To use this library, we need to configure it properly in our code. I will now go through the process of setting it up.
First, we need to use the method vrt.start(), which initializes the tool’s actions.
Afterwards, it is worth using the method vrt.stop(), which stops the test execution and enables sending the test results to the installed Visual Regression Tracker instance.

Moreover, I proceed with the defined test.
I modified the URL address of the tested site in my example to introduce an issue and observe how it affects the test results.

After running the test, we should see an exception indicating the failure. Similarly, the failure will be visible in Visual Regression Tracker.


What other options are availlable?

In Visual Regression Tracker, it’s possible to set a mask for specific elements and choose a color that will be applied to them.
Additionally, we have the option to disable animations on the page, which helps create more stable tests by preventing inconsistencies caused by motion.
The clip option allows us to take a screenshot based on specific coordinates. For example, if we want to capture only certain elements using predefined coordinates, we can use this feature. However, in most cases, it’s better to use a specific selector to target elements directly—but the option is available if needed.

if the detected change is expected, we can confirm it by clicking the “Approve” button. However, if we determine that the change is incorrect, we can dismiss it by clicking the “Reject” button.
For the purpose of this article, I’ve decided that the detected change is a failure. As a result, the test in Visual Regression Tracker was labeled as “Failed”.
When we rerun the test in Visual Studio Code, we can still see the bug. However, from Visual Regression Tracker’s perspective, the test is now labeled as “Unresolved” instead of “Failed”. This means that, just like in the previous run, we need to manually decide whether the change is a bug or an expected modification. The tool registers the change but cannot determine on its own whether it is correct.
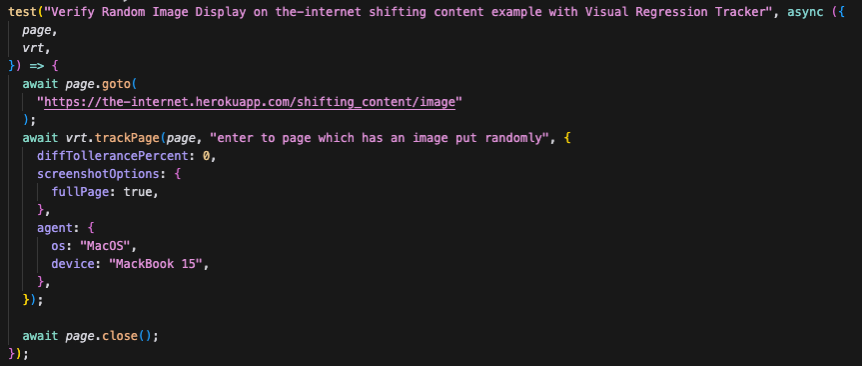
Setting the parameter ?mode=random&pixel_shift=1200 causes the picture to change its position randomly with each run. As a result, the test will be marked as “Unresolved” almost every time, since the image is intentionally moving. To achieve more predictable results, I set a static URL for the page, removing the random movement of the image.
Setting a parameter ?mode=random&pixel_shift=1200 means that the picture randomly changes its position in every run. As a result, we will get „unresolved” in almost every run because on purpose our test is created like that. For more predictable results I set a basic URL for the page, removing random movement of the picture.
if you plan to use Visual Regression Tracker or another tool to detect potential visual regressions or changes, it’s important to work in a stable environment.
The best approach is to compare two environments—for example:
- Staging (which closely resembles the production version of the app)
- Development (which contains the latest changes in progress)
This helps minimize unnecessary noise and ensures that the tool effectively highlights critical changes rather than introducing confusion.
How do we take a screenshot of a specific element?
To take a screenshot of a single element, the easiest way is to find the element using a specific selector.
In the example below, Playwright first locates the first element matching the heading selector. Then, I use the trackElementHandle method from Visual Regression Tracker, which captures a screenshot of the element. Finally, the screenshot is sent to our instance of Visual Regression Tracker.

The trackElementHandle method offers many useful options. We can specify which element to capture, determine whether the screenshot includes the background, set a custom name for the screenshot, and use other parameters as needed.
If our web application has a selector that appears multiple times, we can use this method to capture a screenshot for each matching element.
Summary
In the article, I demonstrated how we can approach the topic of visual regression in automated testing for Playwright. This allows us to identify potential issues that may arise in our web applications after changes are introduced by the team. It is particularly useful for important landing pages, where even minor discrepancies can impact conversion rates.